Get the code on GitHub
Premise
Beer is the most popular alcoholic drink in the world. It is brewed all over the world in dozens of different styles. With so many styles and techniques, there is a lot of room for creativity. At the same time, there is a lot of room for criticism.
Websites like BeerAdvocate.com and RateBeer.com that allows people rate and review various beers. They provide a reference for people looking to try new beers. As such, these ratings will affect consumer choices in beer, as well as overall perception towards particular brands.
Thought: What if we could predict overall ratings?
The ability to predict average rating could be very useful for small breweries looking to experiment with new beers.
Strategy
I scraped data for 5000 beers brewed in the US from Ratebeer.com using BeautifulSoup and Selenium.
I used a subset of the data to train a Ridge Regression model to predict average user rating for a given beer.
Features explored:
- Alcohol by Volume (ABV)
- Calories
- State of origin
- Beer Style
- Title of beer
- Description keywords
ABV showed a seemingly logarithmic relationship with average score.
A strong correlation (r2=0.99) was found between ABV and Calories, so the latter was not used in the final model.
State and Beer style: These values are categorical in nature, so a one-hot binary encoding was used to generate numerical features through the patsy library.
Title and description keywords were explored in an attempt to model preference based on label perception or flavor.
Title: The number of words in the title was used as a feature in training the model.
Description keywords: frequently-occurring keywords were extracted from the beer descriptions, and a one-hot binary feature was applied for the most frequent keywords. Keywords that showed potential predictive value (non-negligible correlation) were considered as features for training the model.
Results
Overall, ABV, State and Style had strong correlations with rating, while features based on the title and description had weak correlations.
The following are the 5 states with the highest average ratings for beers. The trained model placed significant weight on the presence of these states when predicting scores.
| State | Score |
|---|---|
| California | 3.78 |
| Michigan | 3.69 |
| Florida | 3.67 |
| Indiana | 3.65 |
| Alaska | 3.65 |

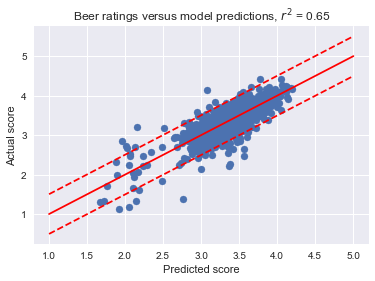
The above plot shows actual scores against model predictions for beer ratings on a testing dataset. The dashed lines indicate the 95% interval (value += 0.5).
In conclusion, 95% of model predictions will be accurate to within half a star (5-star rating system).
Technologies
Python
- BeautifulSoup
- Selenium
- numpy
- pandas
- patsy
- nltk
- scikit-learn
- matplotlib
“Random” Thoughts
- “All models are wrong, but some are useful.” - George Box